
Ecological pyramids are graphical representations of the trophic structure of an ecosystem. They illustrate the distribution of the number of organisms, biomass, or energy across different trophic levels, beginning with producers and extending to consumers. These diagrams help explain how organisms are organized within food chains and how energy and biological material are distributed throughout an ecosystem.
In most terrestrial ecosystems, producers such as green plants form the base of the ecological pyramid, followed by primary consumers, secondary consumers, and tertiary consumers. However, the shape of an ecological pyramid varies depending on what is being measured and the type of ecosystem being studied.
There are three main types of ecological pyramids: the pyramid of numbers, the pyramid of biomass, and the pyramid of energy. Each represents a different ecological characteristic and provides valuable information about ecosystem structure and functioning.
The concept of ecological pyramids is important in ecology because it helps students understand feeding relationships, trophic-level organization, energy transfer, and the ecological balance between organisms. Studying these pyramids also reveals why energy decreases at successive trophic levels and why some ecological pyramids may appear inverted under particular conditions.
In this article, we will explore the definition, components, types, examples, significance, and limitations of ecological pyramids, with explanations designed for B.Sc. and M.Sc. Zoology students.
Definition of an Ecological Pyramid
An ecological pyramid is a graphical representation of the quantitative relationship between organisms at different trophic levels in an ecosystem. It shows the number of organisms, the amount of biomass, or the quantity of energy present at each trophic level of a food chain.
Ecological pyramids were developed from the study of trophic relationships and are commonly associated with the ecological work of Charles Elton, who described the organization of food chains and ecological relationships in his book Animal Ecology (1927).
In an ecological pyramid, each horizontal level represents a trophic level. Producers, such as green plants and algae, generally occupy the lowest level, while primary consumers, secondary consumers, and higher-level consumers occupy the levels above them.
The width of each level represents the quantity of the ecological parameter being measured. Depending on the type of pyramid, this may indicate the number of organisms, their total dry mass per unit area or volume, or the rate of energy transfer per unit area per unit time.
Ecological pyramids are classified into three main types:
- Pyramid of numbers: Represents the number of individual organisms at each trophic level.
- Pyramid of biomass: Represents the total biomass at each trophic level at a particular time.
- Pyramid of energy: Represents the flow of energy through successive trophic levels over a given period.
These representations help ecologists compare ecosystem structures and understand the distribution of organisms and resources within food chains.
Components and Trophic Levels of an Ecological Pyramid
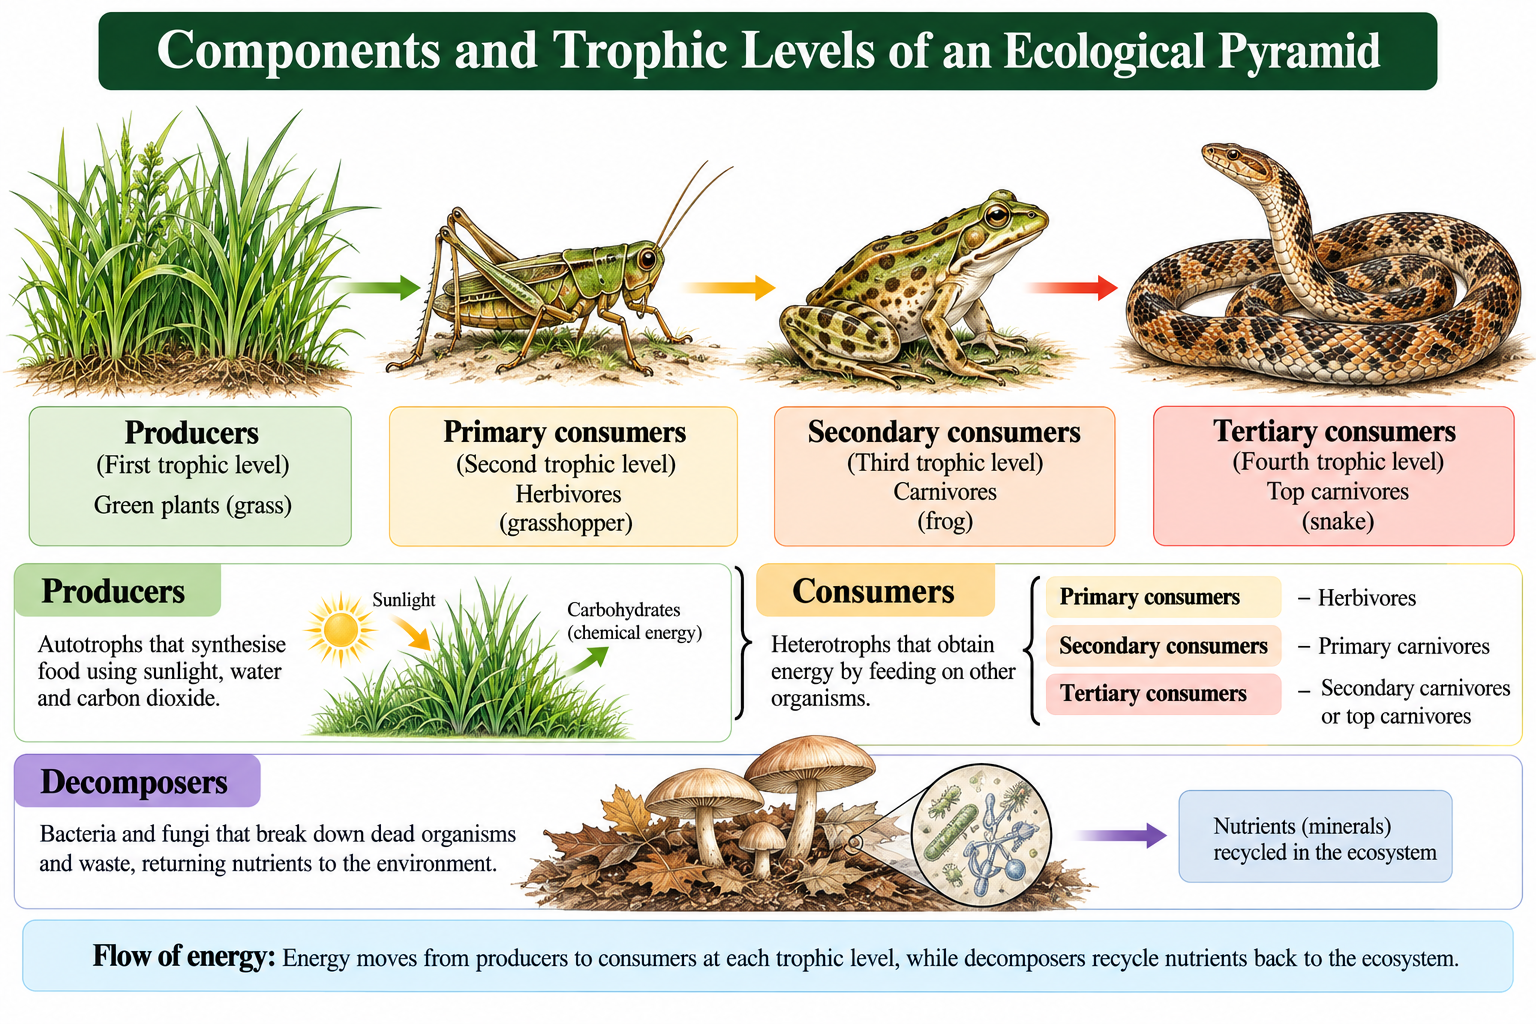
An ecological pyramid consists of different trophic levels that represent the feeding relationships among organisms in an ecosystem. Each level occupies a particular position in a food chain and plays a role in energy transfer and nutrient cycling.
1. Producers (First Trophic Level)
Producers form the base of most ecological pyramids. They include green plants, algae, and other photosynthetic organisms that convert solar energy into chemical energy through photosynthesis. In some ecosystems, chemosynthetic microorganisms serve as primary producers.
Examples: Grass, trees, phytoplankton and algae.
2. Primary Consumers (Second Trophic Level)
Primary consumers feed directly on producers and are generally herbivores. They transfer the energy stored in plant material to higher trophic levels.
Examples: Grasshoppers, rabbits, deer and zooplankton.
3. Secondary Consumers (Third Trophic Level)
Secondary consumers feed on primary consumers. They may be carnivores or omnivores, depending on their diet.
Examples: Frogs feeding on insects, small predatory fish and insectivorous birds.
4. Tertiary Consumers (Fourth Trophic Level)
Tertiary consumers feed on secondary consumers and occupy a higher trophic position in a food chain.
Examples: Large predatory fish, snakes feeding on frogs, and some birds of prey, depending on the ecosystem and food chain.
5. Quaternary Consumers and Apex Predators
Some food chains contain additional trophic levels. Quaternary consumers feed on tertiary consumers, while apex predators occupy the highest position in a particular food chain and have few or no natural predators as adults.
Examples: Tigers, orcas and certain large birds of prey, depending on the ecosystem and food chain.
Example of Trophic Levels
A simple terrestrial food chain illustrates the arrangement of trophic levels:
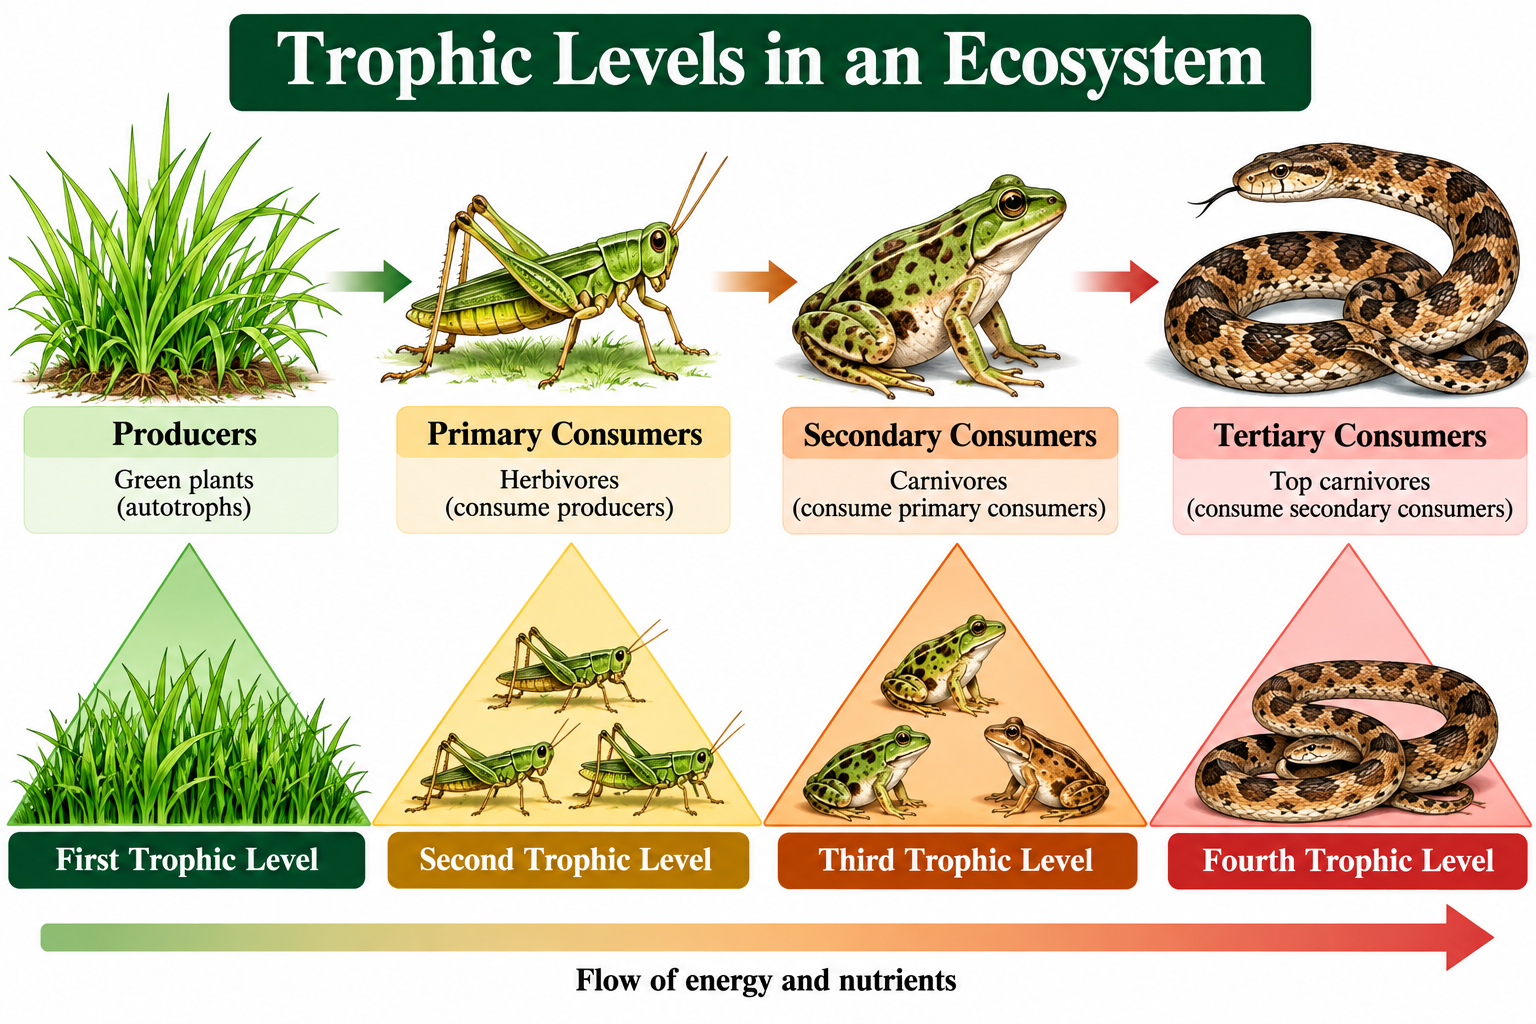
Grass → Grasshopper → Frog → Snake
- First trophic level: Grass (producer)
- Second trophic level: Grasshopper (primary consumer)
- Third trophic level: Frog (secondary consumer)
- Fourth trophic level: Snake (tertiary consumer)
The arrows indicate the direction of energy transfer, from the organism being eaten to the organism that consumes it.
- Producers usually form the base of an ecological pyramid.
- Energy decreases at successive trophic levels because organisms use much of the energy they obtain for metabolism, movement, growth and other life processes.
- Not every food chain contains four or five trophic levels.
- Omnivores may feed at more than one trophic level, so real food webs are more complex than a simple pyramid.
- Decomposers act on dead material from all trophic levels and are not adequately represented by a simple grazing food-chain pyramid.
Types of Ecological Pyramids
Ecological pyramids are classified into three main types based on the ecological parameter represented at each trophic level. These are the pyramid of numbers, the pyramid of biomass, and the pyramid of energy. Each type provides a different perspective on the structure and functioning of an ecosystem.
1. Pyramid of Numbers
A pyramid of numbers represents the number of individual organisms present at each trophic level in a food chain, regardless of their size or biomass.
The width of each level corresponds to the number of organisms occupying that trophic level. Depending on the ecosystem and the relationship between organisms, a pyramid of numbers may be upright, inverted, or irregular in shape.
A. Upright Pyramid of Numbers
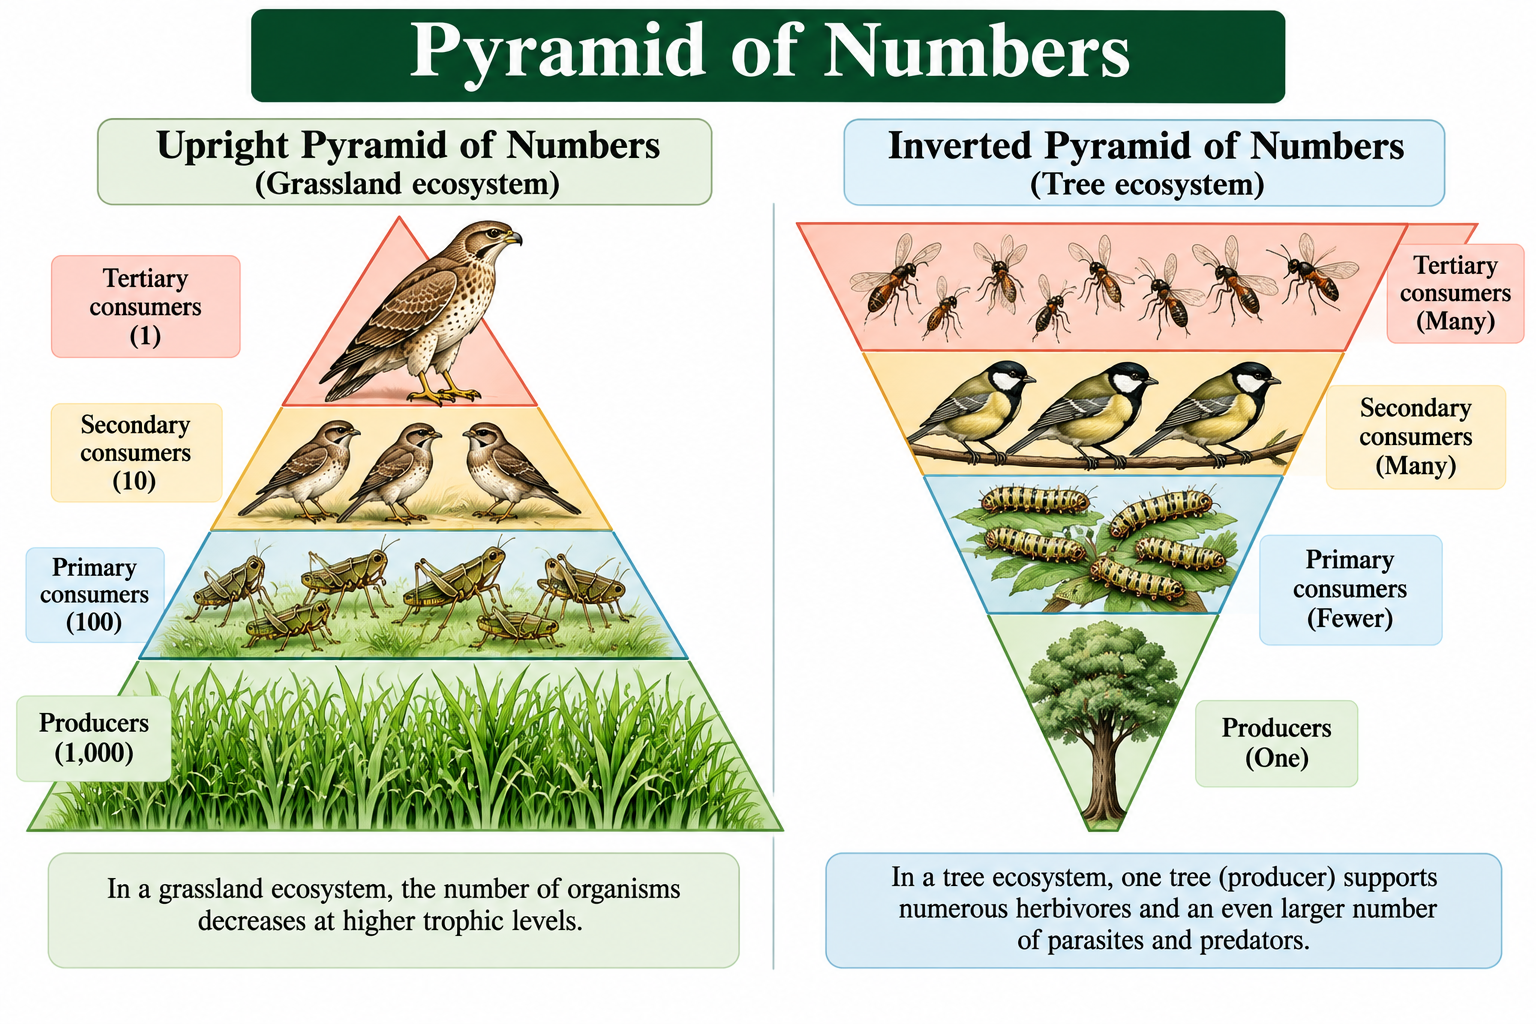
An upright pyramid of numbers occurs when the number of organisms decreases at successive trophic levels. It is commonly observed in grassland ecosystems.
Example: Grassland ecosystem
Grass → Grasshoppers → Frogs → Snakes
In this ecosystem, numerous grass plants support a smaller number of grasshoppers. These are consumed by fewer frogs, which in turn support an even smaller number of snakes.
The number of organisms generally decreases toward the top of the pyramid.
B. Inverted Pyramid of Numbers
An inverted pyramid of numbers may occur when a single large producer supports numerous smaller consumers or parasites.
Example: Tree ecosystem
A single tree may support hundreds of insects, which may in turn host an even greater number of parasites or parasitoids. In such cases, the number of organisms increases at higher trophic levels, producing an inverted or irregular pyramid.
Characteristics of the Pyramid of Numbers
- It represents the number of individual organisms at each trophic level.
- It does not consider the size or biomass of organisms.
- It may be upright, inverted, or irregular.
- It is useful for understanding the numerical distribution of organisms in a food chain.
Limitations of the Pyramid of Numbers
- It treats organisms of different sizes as equivalent units.
- It does not indicate the biomass or energy available at each trophic level.
- It may not adequately represent complex food webs or organisms feeding at multiple trophic levels.
The pyramid of numbers is therefore useful for studying the numerical relationships among organisms, but it cannot independently explain energy transfer or the total biological material present in an ecosystem.
Pyramid of Biomass
A pyramid of biomass is an ecological pyramid that represents the total biomass of organisms present at each trophic level in an ecosystem at a particular time. Biomass refers to the mass of living biological material, usually expressed as dry mass per unit area or volume.
Unlike the pyramid of numbers, which counts individual organisms, the pyramid of biomass considers the amount of biological material present at each trophic level. It therefore provides a better understanding of the distribution of living material within an ecosystem.
The shape of a pyramid of biomass depends on the ecosystem being studied. It may be upright or inverted.
A. Upright Pyramid of Biomass
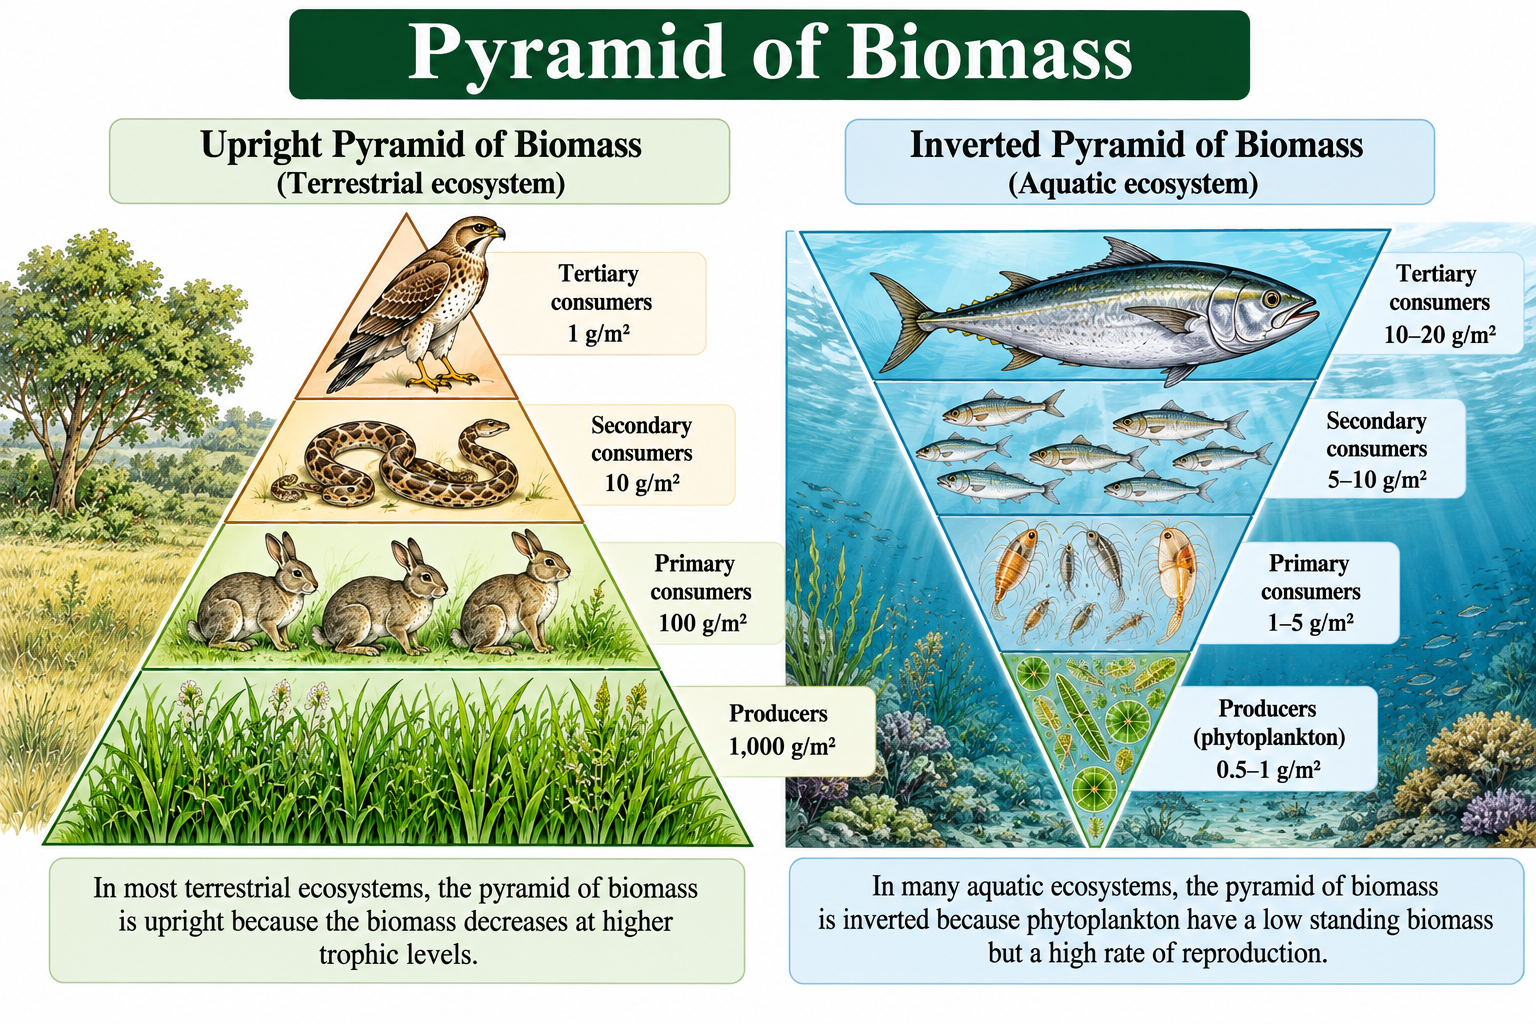
An upright pyramid of biomass is generally found in terrestrial ecosystems, where the biomass of producers is greater than that of primary consumers and higher trophic levels.
Example: Grassland ecosystem
Grass → Grasshoppers → Frogs → Snakes
In a grassland ecosystem, grasses and other plants accumulate a large amount of biomass. Herbivores consume this plant material, while carnivores occupy the higher trophic levels. Consequently, the standing biomass generally decreases from producers to top consumers.
Characteristics:
- Producers have the greatest standing biomass.
- Biomass generally decreases at successive trophic levels.
- It is commonly observed in grassland and forest ecosystems.
B. Inverted Pyramid of Biomass
An inverted pyramid of biomass is commonly observed in some aquatic ecosystems, particularly those dominated by phytoplankton.
Example: Aquatic ecosystem
Phytoplankton → Zooplankton → Small fish → Large fish
At a particular time, the standing biomass of phytoplankton may be lower than that of the zooplankton feeding on them. This is possible because phytoplankton reproduce rapidly and are consumed continuously, allowing them to support a greater biomass of consumers despite their low standing biomass.
Characteristics:
- The standing biomass of producers may be lower than that of primary consumers.
- It is often associated with aquatic ecosystems.
- Rapid producer turnover and continuous production help maintain consumer populations.
Importance of the Pyramid of Biomass
- It shows the distribution of living material among trophic levels.
- It helps compare the standing biomass of producers and consumers.
- It provides information about ecosystem structure.
- It helps ecologists study differences between terrestrial and aquatic ecosystems.
Limitations of the Pyramid of Biomass
- It represents biomass at a particular time rather than the total biomass produced over a period.
- It may be upright or inverted depending on the ecosystem.
- It does not directly measure the energy transferred between trophic levels.
- Biomass estimates can vary depending on whether fresh mass or dry mass is used.
Therefore, the pyramid of biomass is useful for understanding the standing biological material at different trophic levels, but it does not independently explain the rate of production or energy flow through an ecosystem.
Pyramid of Energy
A pyramid of energy is an ecological pyramid that represents the amount of energy available or transferred at each trophic level of an ecosystem over a specified period. It illustrates the flow of energy from producers to primary consumers, secondary consumers, and higher-level consumers.
Energy enters most ecosystems through sunlight, which is captured by photosynthetic organisms and converted into chemical energy. This energy passes through food chains as organisms consume one another. However, a considerable proportion of energy is used for metabolism, movement, growth, and other life processes, with much of it ultimately dissipated as heat.
Energy pyramids are usually expressed in units such as kilojoules per square metre per year (kJ m⁻² yr⁻¹) for terrestrial ecosystems or kilojoules per cubic metre per year for aquatic ecosystems, depending on the system being studied.
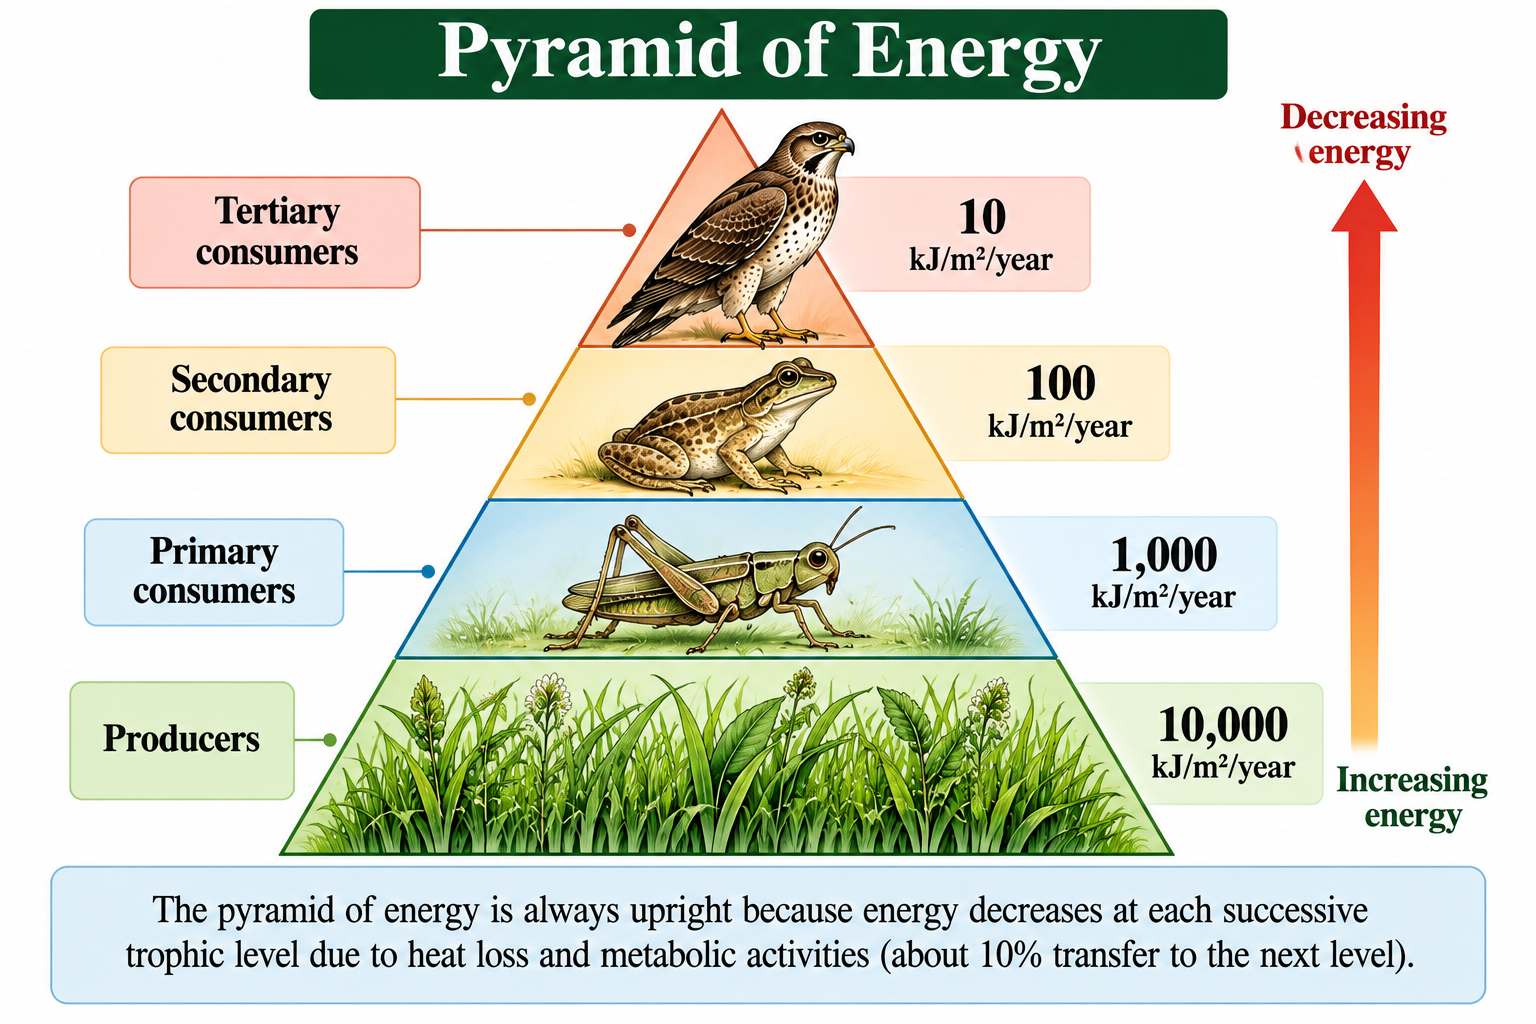
Structure of the Pyramid of Energy
The pyramid of energy consists of successive trophic levels:
- Producers: Capture solar energy and convert it into chemical energy.
- Primary consumers: Obtain energy by feeding on producers.
- Secondary consumers: Obtain energy by feeding on primary consumers.
- Tertiary consumers: Obtain energy by feeding on secondary consumers.
The amount of energy available generally decreases at each successive trophic level.
Example of an Energy Pyramid
Consider a simplified grassland ecosystem in which the energy available at successive trophic levels is represented as follows:
| Trophic level | Organisms | Illustrative energy |
|---|---|---|
| Producers | Grass | 10,000 kJ/m²/year |
| Primary consumers | Grasshoppers | 1,000 kJ/m²/year |
| Secondary consumers | Frogs | 100 kJ/m²/year |
| Tertiary consumers | Snakes | 10 kJ/m²/year |
These values are illustrative rather than measurements from a particular ecosystem. They demonstrate the general decrease in energy available at successive trophic levels.
The 10% Law of Energy Transfer
The 10% law, proposed by Raymond Lindeman in 1942, states that approximately 10% of the energy available at one trophic level is transferred to the next trophic level in a simplified ecological model.
For example, if producers contain 10,000 units of energy, primary consumers might receive approximately 1,000 units, secondary consumers 100 units, and tertiary consumers 10 units.
The remaining energy is not all lost through one process. Much is used in respiration and other metabolic activities, dissipated as heat, or remains in material that is not consumed or assimilated by the next trophic level.
The 10% value is a useful approximation, not a universal fixed percentage. Actual transfer efficiencies vary among ecosystems, organisms, and trophic levels.
Why Is the Pyramid of Energy Always Upright?
The pyramid of energy is always upright because the amount of energy transferred to a higher trophic level is less than the energy available at the preceding level in a properly defined ecosystem energy budget.
This occurs because:
- Organisms use energy for respiration and other metabolic activities.
- Much of the energy is dissipated as heat.
- Not all organisms or biological material are consumed.
- Some consumed material is not assimilated and is released as waste.
Consequently, energy available to higher trophic levels decreases progressively along the food chain.
Importance of the Pyramid of Energy
- It explains the unidirectional flow of energy through ecosystems.
- It illustrates energy loss between successive trophic levels.
- It helps explain why food chains generally contain relatively few trophic levels.
- It supports comparisons of energy transfer and ecological efficiency.
- It helps ecologists understand ecosystem productivity and the energetic basis of food webs.
Limitations of the Pyramid of Energy
- Accurate construction requires reliable measurements of energy flow over a specified period.
- Energy transfer efficiencies differ among organisms and ecosystems.
- A simple pyramid may not adequately represent complex food webs or organisms that feed at multiple trophic levels.
- It does not, by itself, describe all nutrient cycling or the movement of matter through an ecosystem.
The pyramid of energy is particularly useful for understanding ecosystem functioning because it measures energy transfer over time. Unlike pyramids of numbers and biomass, it cannot be inverted when constructed using consistent trophic-level energy budgets.
Differences Between the Three Types of Ecological Pyramids
The three types of ecological pyramids differ in the ecological parameter they represent, their units of measurement, and their possible shapes. The pyramid of numbers represents the number of organisms, the pyramid of biomass represents standing biomass, and the pyramid of energy represents energy transfer over time.
Comparison Table
| Feature | Pyramid of Numbers | Pyramid of Biomass | Pyramid of Energy |
|---|---|---|---|
| Definition | Represents the number of organisms at each trophic level | Represents the standing biomass at each trophic level | Represents energy available or transferred at each trophic level over time |
| Parameter measured | Number of individuals | Mass of living biological material | Energy flow or transfer |
| Common units | Number of individuals per trophic level or unit area | g/m², kg/m² or other mass per unit area | kJ/m²/year or another energy-flow unit |
| Shape | Upright, inverted or irregular | Upright or inverted | Always upright when properly constructed |
| Terrestrial ecosystems | May be upright or inverted | Generally upright | Upright |
| Aquatic ecosystems | May vary | May be inverted | Upright |
| Main advantage | Shows numerical relationships between organisms | Shows the distribution of standing biological material | Shows energy transfer and losses between trophic levels |
| Major limitation | Does not account for organism size | Does not directly measure energy flow or production rate | Requires measurements over a specified period |
Key Differences Explained
1. Difference in the parameter measured
The pyramid of numbers counts individual organisms, regardless of their size. The pyramid of biomass measures the mass of living material at each trophic level at a particular time. The pyramid of energy measures energy flow through trophic levels over a specified period.
2. Difference in shape
The pyramid of numbers may be upright, inverted or irregular, depending on the ecosystem. The pyramid of biomass is generally upright in terrestrial ecosystems but may be inverted in aquatic ecosystems. The pyramid of energy is always upright when the energy budget and trophic levels are defined consistently.
3. Difference in ecological significance
The pyramid of numbers helps explain the numerical distribution of organisms. The pyramid of biomass provides information about standing biological material, while the pyramid of energy explains energy transfer and the progressive reduction in energy available to higher trophic levels.
Which Ecological Pyramid Is Most Reliable?
The pyramid of energy is generally the most informative of the three for understanding energy transfer in an ecosystem because it accounts for energy flow over time. However, no single pyramid provides a complete description of an ecosystem. Ecologists use all three representations, along with food webs and other ecological measurements, to understand ecosystem structure and functioning.
Upright and Inverted Ecological Pyramids
Ecological pyramids may have different shapes depending on the number of organisms, the standing biomass, or the energy available at successive trophic levels. Based on their shape, ecological pyramids can be described as upright, inverted, or, in some cases, irregular.
1. Upright Ecological Pyramid
An upright ecological pyramid has a broad base and a narrow top. The quantity represented decreases from the lower trophic levels to the higher trophic levels.
This shape is commonly observed in terrestrial ecosystems, where producers generally have greater standing biomass than consumers. Energy pyramids are also always upright when constructed using consistent energy-flow measurements.
Examples:
- Pyramid of numbers in a typical grassland food chain.
- Pyramid of biomass in a forest ecosystem.
- Pyramid of energy in both terrestrial and aquatic ecosystems.
Characteristics:
- The base represents producers.
- Higher trophic levels generally have progressively smaller values for the parameter represented.
- It reflects decreasing energy availability at successive trophic levels in an energy pyramid.
2. Inverted Ecological Pyramid
An inverted ecological pyramid has a narrower base and a broader upper portion. This occurs when the quantity represented is greater at a higher trophic level than at a lower one.
Inverted pyramids can occur in pyramids of numbers and biomass, but not in a properly constructed pyramid of energy.
Examples:
A. Inverted pyramid of numbers: A single tree may support hundreds of insects, and those insects may host numerous parasites or parasitoids. Depending on the organisms counted, the pyramid may be inverted or irregular.
B. Inverted pyramid of biomass: In some aquatic ecosystems, the standing biomass of phytoplankton may be lower than that of the zooplankton feeding on them. The rapid reproduction and turnover of phytoplankton allow a relatively small standing biomass to support a larger consumer biomass.
Characteristics:
- The quantity represented may increase from producers to one or more consumer levels.
- It can occur in certain terrestrial or aquatic food chains.
- It does not indicate that energy increases at successive trophic levels.
3. Irregular Ecological Pyramid
An irregular ecological pyramid occurs when the values at successive trophic levels do not form a simple, consistently narrowing or widening pattern.
It may be observed in pyramids of numbers, particularly in ecosystems involving large producers, parasites, and complex feeding relationships.
Example: In a tree-based food chain, one tree may support many herbivorous insects, while the number of insectivorous birds and other predators may be smaller. If parasites are included, the number of organisms at higher trophic levels may increase again.
Important Distinction
The shape of an ecological pyramid depends on the parameter being measured. An inverted pyramid of numbers or biomass does not mean that the ecosystem violates the principle of energy loss between trophic levels.
Energy is transferred inefficiently through food chains, and some energy is dissipated as heat at each trophic level. Therefore, a properly constructed pyramid of energy remains upright even when the pyramids of numbers or biomass are inverted.
Importance of Ecological Pyramids
Ecological pyramids are important tools in ecology because they provide a simplified representation of the trophic structure of an ecosystem. They help explain the distribution of organisms, the amount of biological material at different trophic levels, and the transfer of energy through food chains.
1. Understanding Trophic-Level Organization
Ecological pyramids illustrate the arrangement of producers, primary consumers, secondary consumers, and higher-level consumers in a food chain. This helps students understand feeding relationships and the organization of ecosystems.
2. Explaining Energy Flow
The pyramid of energy demonstrates that less energy is available at successive trophic levels. This occurs because organisms use energy for metabolism and other life processes, while some energy is dissipated as heat or remains in material that is not transferred to the next trophic level.
3. Understanding Biomass Distribution
The pyramid of biomass shows the standing biomass present at each trophic level. It helps ecologists compare the amount of living biological material in terrestrial and aquatic ecosystems.
4. Studying the Numerical Distribution of Organisms
The pyramid of numbers represents the number of individual organisms at each trophic level. It helps illustrate how many producers may support consumers and how these numerical relationships vary among ecosystems.
5. Explaining Food-Chain Length
Energy transfer between trophic levels is inefficient, limiting the energy available to organisms at higher levels. Ecological pyramids therefore help explain why food chains generally contain relatively few trophic levels.
6. Assessing Ecosystem Productivity
Energy pyramids, when considered alongside productivity measurements, help ecologists understand how energy enters an ecosystem and is transferred through its food chain. Biomass pyramids provide complementary information about standing biological material.
7. Supporting Ecosystem Management and Conservation
Ecological pyramids help illustrate the relationships between producers and consumers. Understanding these relationships can support ecosystem management, wildlife conservation, and the assessment of how disturbances affecting one trophic level may influence other organisms.
8. Comparing Different Ecosystems
Ecological pyramids can be used to compare ecosystems such as grasslands, forests, ponds, lakes, and oceans. Differences in the shape and values of pyramids provide insights into their trophic organization and ecological functioning.
9. Supporting Ecological Education and Research
Ecological pyramids provide a simple visual method for explaining complex ecological relationships. They are widely used in biology education and can support ecological studies when combined with measurements of population size, biomass, productivity, and energy flow.
In conclusion, ecological pyramids are valuable tools for understanding ecosystem structure and functioning. Although each type has limitations, together they provide complementary information about the distribution of organisms, standing biomass, and energy transfer across trophic levels.
Limitations of Ecological Pyramids
Although ecological pyramids are useful for understanding trophic structure and ecosystem functioning, they have several limitations. They simplify complex ecological relationships and cannot represent every aspect of an ecosystem.
1. They Do Not Represent Complex Food Webs Adequately
Ecological pyramids are usually constructed around trophic levels in a simplified food chain. However, natural ecosystems contain interconnected food webs in which organisms may consume several different types of prey.
For example, an omnivorous bird may feed on seeds, insects, and small animals, occupying different trophic positions depending on its diet.
2. The Pyramid of Numbers Ignores Organism Size
The pyramid of numbers counts individuals without considering their size or biomass. A single large tree and a small herbaceous plant may each be counted as one organism, even though their biomass differs greatly.
Consequently, the pyramid of numbers may not accurately reflect the amount of biological material supporting consumers.
3. The Pyramid of Biomass Represents Only Standing Biomass
The pyramid of biomass measures the biomass present at a particular time. It does not directly indicate the rate at which biomass is produced or the amount of energy transferred over a period.
For example, phytoplankton may have a low standing biomass but reproduce rapidly, supporting a substantial population of zooplankton.
4. The Pyramid of Energy Requires Detailed Measurements
Constructing a pyramid of energy requires estimates of energy flow through different trophic levels over a specified period. Obtaining reliable measurements can be difficult in complex natural ecosystems.
Differences in respiration, consumption, assimilation, and energy transfer efficiency also make energy budgets variable among ecosystems.
5. Decomposers Are Not Adequately Represented
Traditional ecological pyramids based on grazing food chains do not fully represent decomposers and detritivores, which obtain energy from dead organic matter produced at multiple trophic levels.
Organisms such as bacteria, fungi, and earthworms play important roles in decomposition and nutrient cycling but are not easily incorporated into a simple pyramid.
6. Omnivores May Occupy Multiple Trophic Levels
Some organisms feed on both plants and animals. Their trophic position may therefore vary depending on the food consumed.
A simple ecological pyramid cannot always represent these feeding relationships accurately.
7. Seasonal and Temporal Changes Are Not Fully Shown
Pyramids of numbers and biomass generally represent a particular observation or sampling period. They may not capture seasonal changes, population fluctuations, migration, or changes in productivity.
Repeated measurements may be necessary to understand how ecosystem structure changes over time.
8. They Do Not Fully Explain Nutrient Cycling
Ecological pyramids primarily illustrate trophic-level quantities or energy transfer. They do not adequately represent the recycling of nutrients such as carbon, nitrogen, and phosphorus between organisms and the physical environment.
Nutrient-cycle diagrams are needed to explain these processes more clearly.
Ecological pyramids provide useful simplified models of ecosystem structure, but they should not be treated as complete representations of natural ecosystems. Their limitations can be addressed by combining them with food-web diagrams, population studies, productivity measurements, nutrient-cycle models, and other ecological methods.
Frequently Asked Questions (FAQs) About Ecological Pyramids
What is an ecological pyramid?
Who introduced the concept of ecological pyramids?
What are the three main types of ecological pyramids?
Why is the pyramid of energy always upright?
Can an ecological pyramid be inverted?
Why is the pyramid of biomass sometimes inverted in aquatic ecosystems?
What is the difference between a pyramid of numbers and a pyramid of biomass?
What is the 10% law of energy transfer?
What is the importance of ecological pyramids?
What are the main limitations of ecological pyramids?
Conclusion
Ecological pyramids are important tools in ecology that help explain the trophic structure, feeding relationships, and functioning of ecosystems. They provide a graphical representation of how organisms are distributed across different trophic levels and how biological material and energy are organized within a food chain. By simplifying complex ecological relationships, ecological pyramids make it easier to understand the interactions between producers, consumers, and the environment.
The three major types of ecological pyramids—pyramid of numbers, pyramid of biomass, and pyramid of energy—provide complementary information about an ecosystem. The pyramid of numbers illustrates the numerical distribution of organisms at different trophic levels, while the pyramid of biomass represents the standing biomass present at each level at a particular time. In contrast, the pyramid of energy explains the transfer of energy through trophic levels over a specified period and demonstrates why energy availability generally decreases toward higher trophic levels.
An important feature of ecological pyramids is that their shapes vary according to the parameter being measured and the ecosystem under consideration. Pyramids of numbers may be upright, inverted, or irregular, whereas pyramids of biomass may be upright or inverted. However, the pyramid of energy is always upright when constructed using consistent energy-flow measurements because energy is lost from the biological production pathway at successive trophic levels.
Despite their usefulness, ecological pyramids have certain limitations. They do not fully represent complex food webs, organisms that occupy multiple trophic levels, decomposers, or the cycling of nutrients through ecosystems. Therefore, ecologists use ecological pyramids alongside food-web diagrams, population studies, productivity measurements, and biogeochemical-cycle models to develop a more complete understanding of ecosystem dynamics.
The study of ecological pyramids is valuable not only for understanding fundamental ecological principles but also for assessing ecosystem productivity, interpreting feeding relationships, and supporting wildlife conservation and environmental management. By understanding how organisms and energy are distributed across trophic levels, students and researchers can better appreciate the interdependence of living organisms and the importance of maintaining ecological balance.
References
- OpenStax. Biology 2e: Energy Flow through Ecosystems. Rice University. Available at: https://openstax.org/books/biology-2e/pages/46-2-energy-flow-through-ecosystems
- NCERT. Biology, Class XII: Ecosystem — Ecological Pyramids. National Council of Educational Research and Training. Available at: https://ncert.nic.in/textbook.php
- Lindeman, R. L. (1942). The trophic-dynamic aspect of ecology. Ecology, 23(4), 399–417. https://doi.org/10.2307/1930126
- National Programme on Technology Enhanced Learning (NPTEL). Ecology: Ecosystem (Part II), Lecture 39. Available at: https://archive.nptel.ac.in/content/storage2/courses/122103039/module6/lec39/6.html
Discover more from Zoologyverse
Subscribe to get the latest posts sent to your email.